This post discusses each part of the 5E Lab. For suggestions, materials and set of the Cemetery Lab, read Part I.

Engage
In a 5E, an Engage should be quick and illicit prior knowledge. For this 5E, students answer these questions to get their brains thinking. This part only takes about 5 minutes for students to write and about a minute to share.
- Who is the oldest person alive that you personally know?
- Did anyone in your family live past 100? If so, who?
- How long do you think people live for? In other words, what’s the average lifespan of people in the United States?
- Recall survivorship curves. Describe the three types of survivorship curves.
Type I:
Type II:
Type III: - Which curve represents humans? _______
- Do you think human survivorship curves have changed in the past 200 years? How?
Explore
The “Explore” portion of the lab is not my own. It is taken from many shared cemetery lab resources from many generous teachers.
Students work in pairs and record their headstone data on Tables 1 and 2.

Next, they read the instructions and fill in their pair data in Tables 3 and 4–just the first column. You can copy one set of tables per pair, or save paper by putting the tables in plastic sleeves (or laminate) and use vis-a-vis markers and wipe off.
Students then enter their pair data (from Tables 3 and 4) on a class spreadsheet using Google Docs. I program the google doc to add the rows for them. After every pair has filled in the spreadsheet, Students use the class data to fill in # deaths, # survivors and % survivorship for Table 3 (Pre 1900) males. If using my spreadsheet linked above, make a copy of the spreadsheet as your “Master” and then make a copy for each period and erase the sample data inside. Also delete columns U and V with their formulas. Thank you to APES teacher Michelle Amos for help with the formulas!
After students calculate % survivorship by hand for the first spreadsheet (Table 3 Pre 1900 Males), copy and paste columns U and V from your “Master” into the spreadsheet. Student calculations by hand should match the computer generated ones.
To save time, I program the google sheet to do the other calculations for Table 3 females, Table 4 males and Table 4 females. I do not program the math calculations for the first spreadsheet, Table 3 males, because I want students to do the math themselves first to understand survivorship.
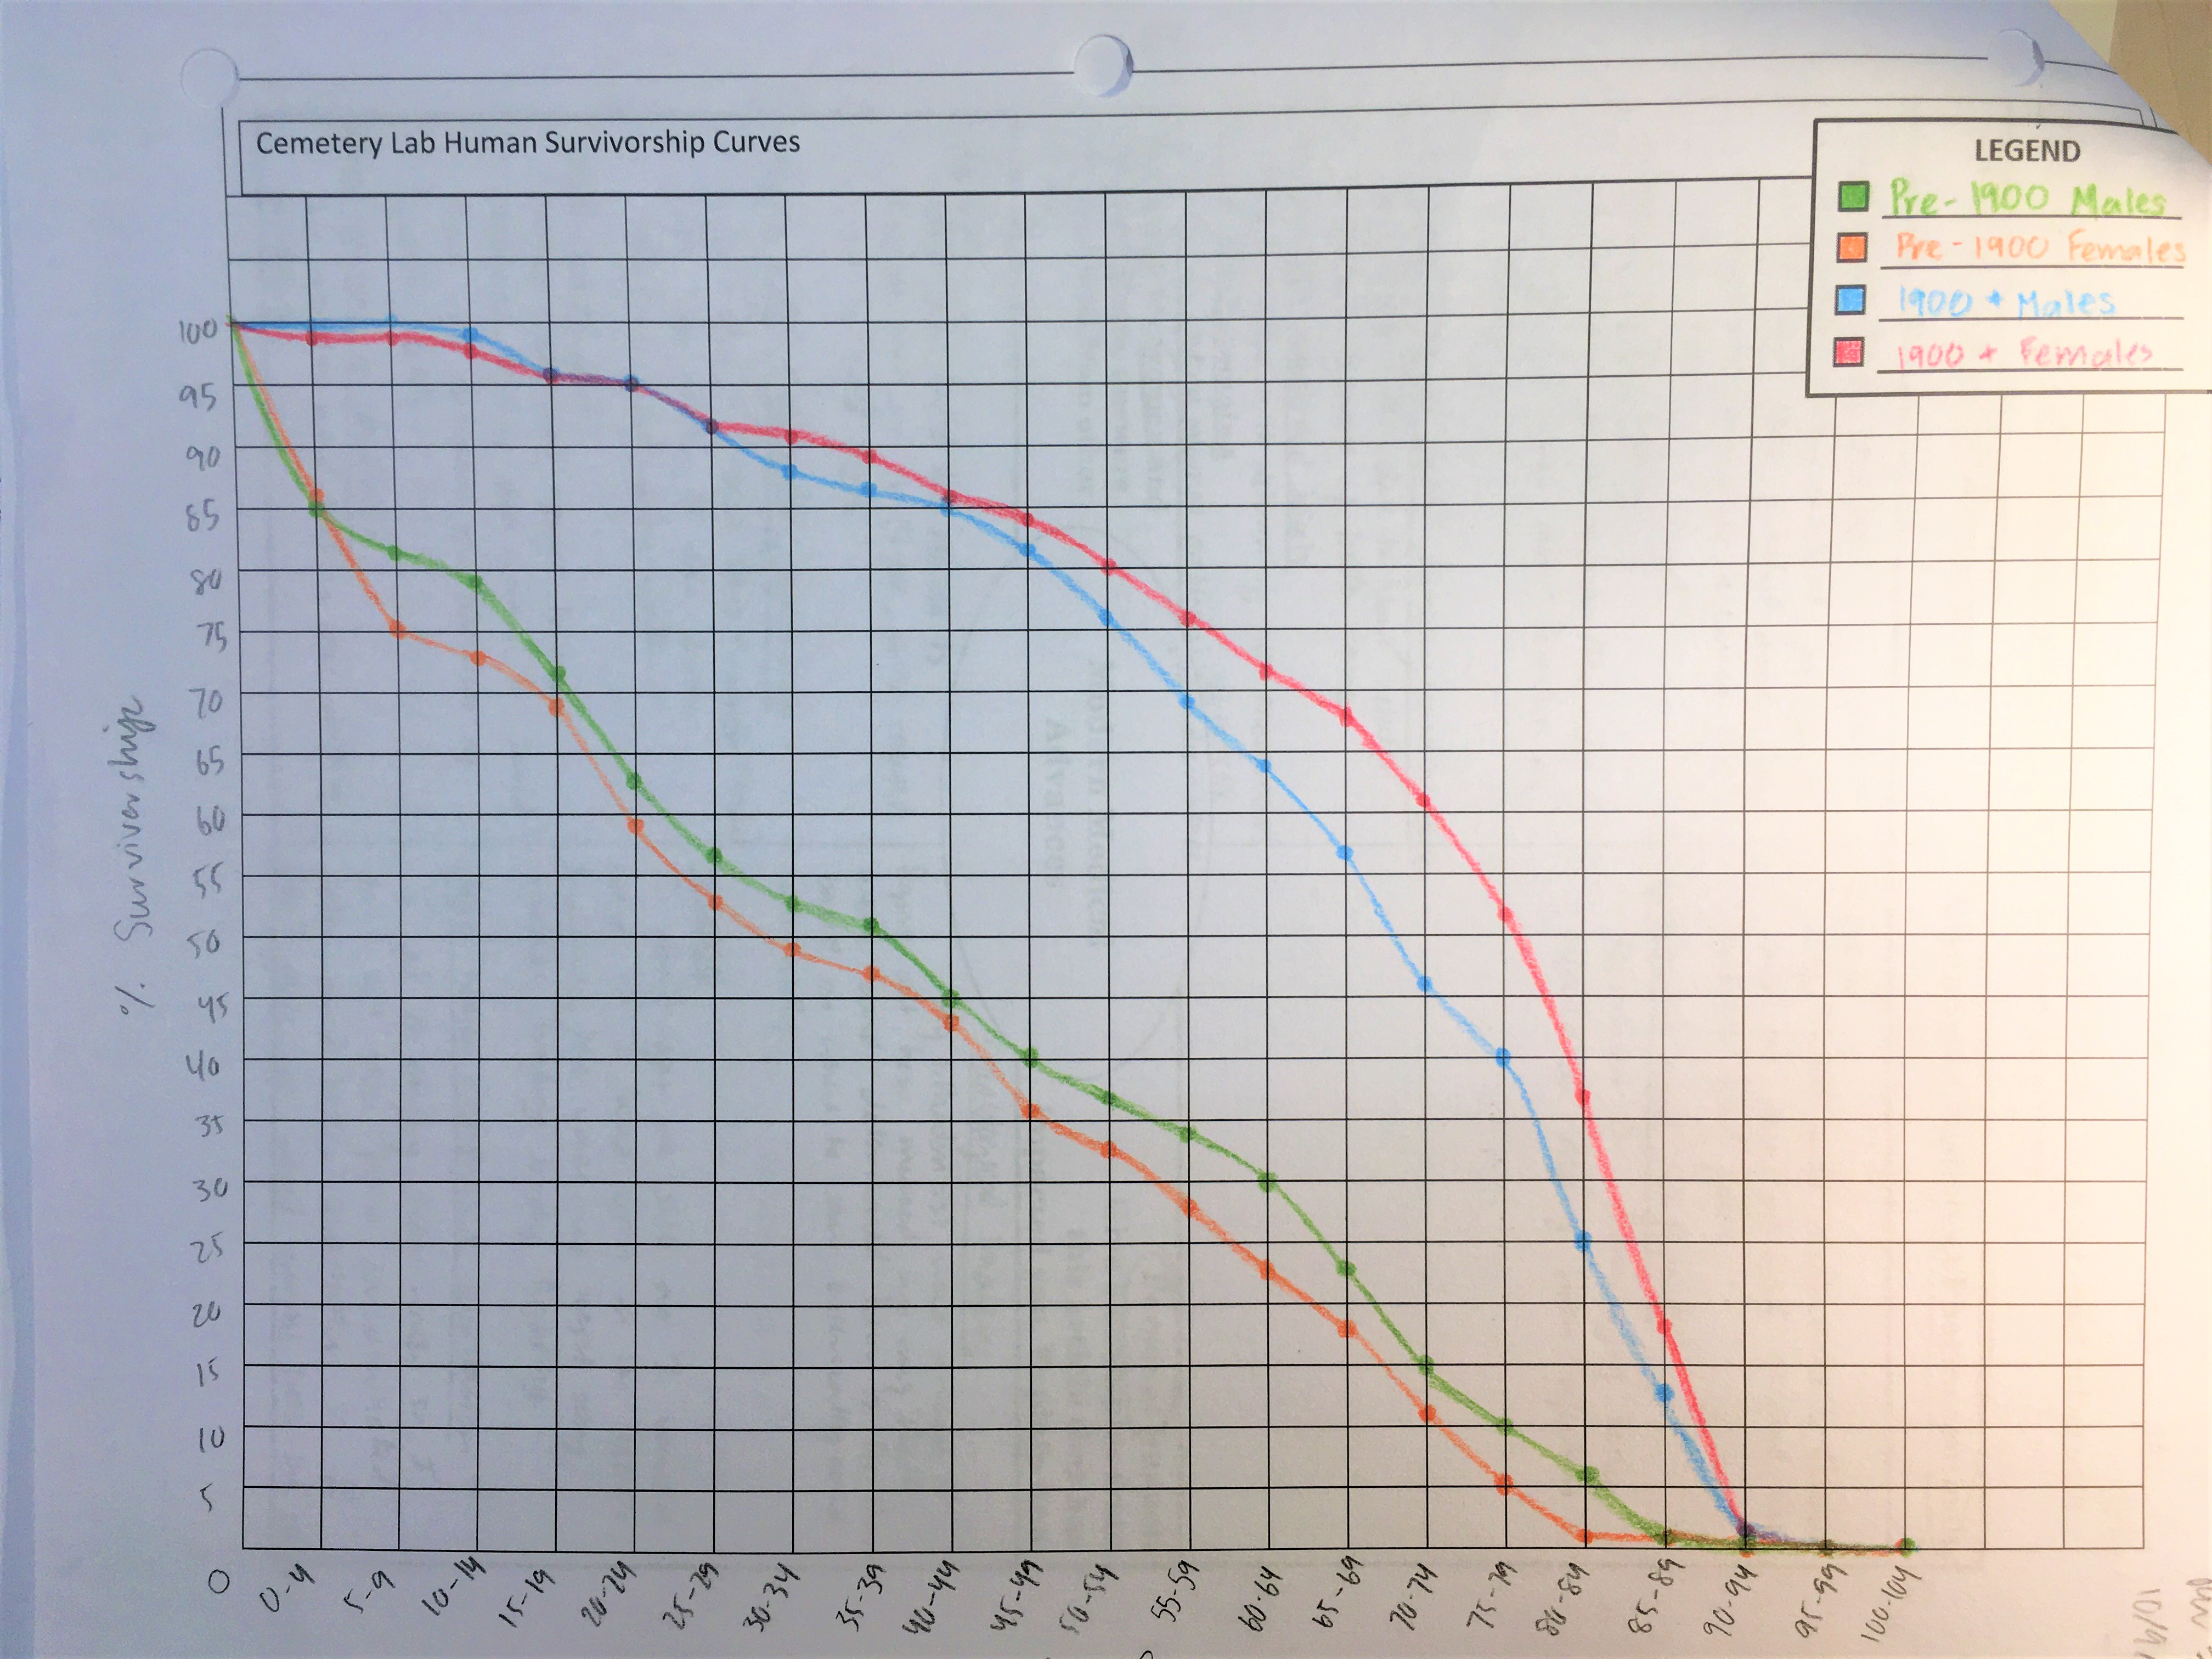
Students make a line graph with 4 lines on the same graph: Pre-1900 males, Pre-1900 Females, 1900+Males and 1900+ Females. Even though the computer can graph for them, I make students hand-graph so they understand not only how to graph, but can better understand the data.
Explain: Student-Sense-Making
In this part of a 5E, students begin to understand their data and make a claim at the end. Students may have some mis-conceptions and wrong ideas which is okay at this point. Walk around and read student claims to see where their thinking is at this point. Students will have the chance to correct their answers later so its not necessary to make sure they have the correct answers now.
Explain: New Understandings and Vocabulary
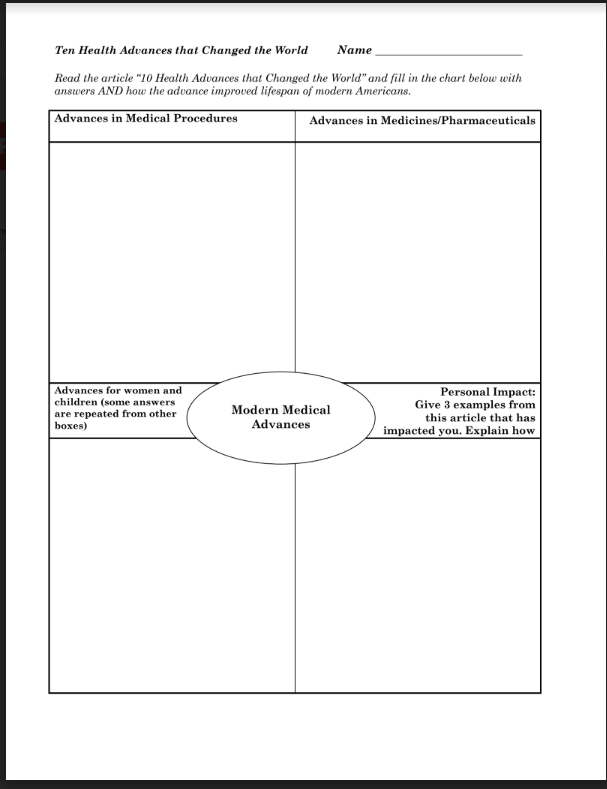
Now is the time to help students gain further understandings of population and introduce medical advances and diseases. I show this video on YouTube. Afterwards, students read this article “Ten Health Advances that Changed the World” and fill out this modified Frayer graphic organizer.
Next, students go back to their questions from sense-making and revise their answers.
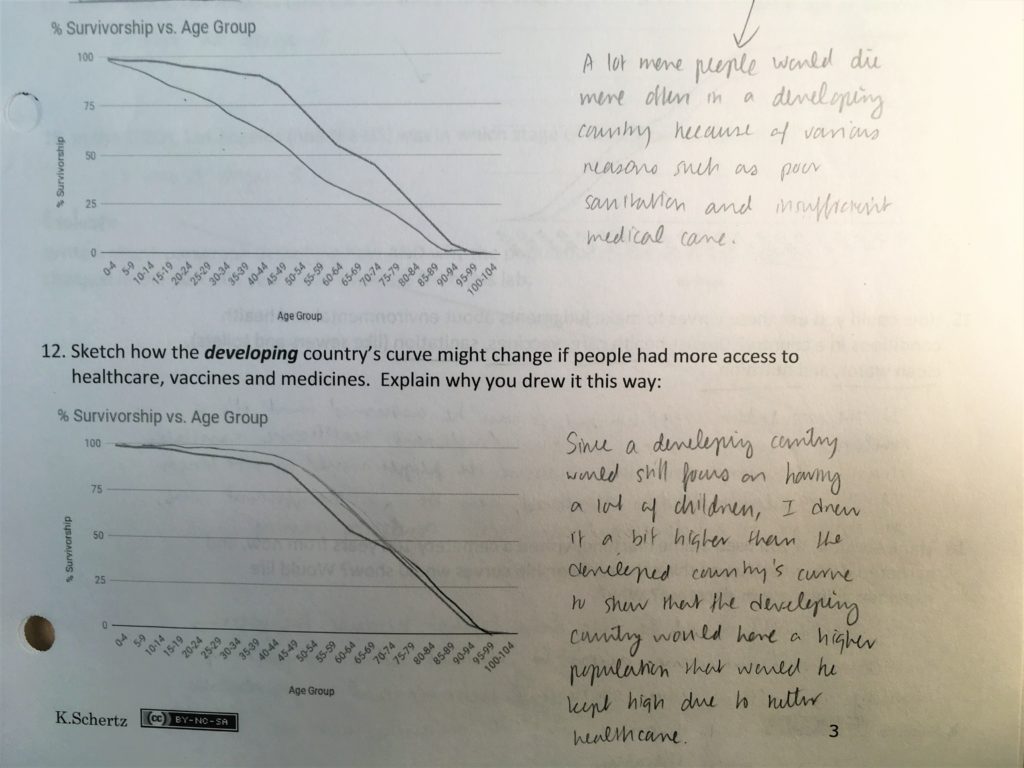
Elaborate: Survivorship Curve Predictions and Demographic Transition
Students show deeper understanding by making predictions as to what would happen to a modern survivorship curve with various scenarios such as disease and pollution. By checking their predictive lines, you can see if they truly understand how survivorship changes. Students also connect survivorship curves with the demographic transition model.
Evaluate
This evaluate is optional. Students write a chunk paragraph describing how AND why the population dynamics of Los Angeles changed in the past 200 years using evidence from this lab.
For more population resources, I have two items on TPT: Population Math Packet with formulas, 3 practice worksheets, practice quiz, quiz with FRQ and answer keys. Also, Draw an Age-Structure Diagram (Population Pyramid).
For more labs per unit in AP® Environmental Science, click on this link.
* AP® is a trademark registered and/or owned by the College Board which was not involved in the production of, and does not endorse this site.
One thought on “Human Population 5E Lab Using Cemetery Data Part II”